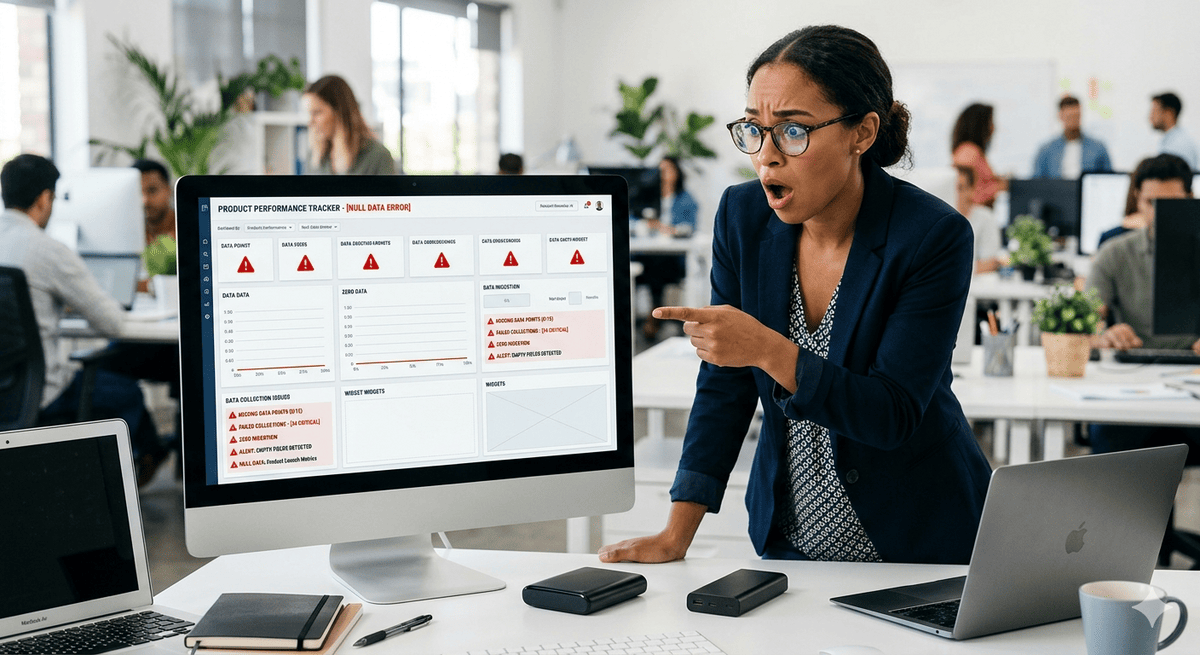
Your Products Are Generating Data You're Not Collecting
Most manufacturers can tell you exactly how many units shipped to which distributor last quarter. Almost none can tell you where those products are right now, who owns them, or whether their owners are happy.
That's not a data problem. That's a structural blind spot, and it's costing you more than you realise.
Every physical product you ship is, at this moment, generating signals. Owners scan QR codes. They register warranties. They call support lines. They order spare parts. They submit warranty claims. Eventually, they dispose of or resell the product. Each one of these interactions carries intelligence about product quality, customer geography, model performance, counterfeit exposure, and demand patterns.
You are almost certainly collecting none of it at the product level.
The Data Your Sales Numbers Can't Tell You
Sales data tells you what left the warehouse. It tells you nothing about what happened after. By the time a product reaches the end-user, routed through distributors, retailers, installers, or resellers, you've already lost the thread.
This is the post-sale black hole. And it's not a niche problem. Manufacturers that sell through indirect channels often have a direct relationship with only a small share of their end customers. For many products shipped, the buyer disappears into a channel the manufacturer cannot see.
What gets lost isn't just contact information. It's the entire operational intelligence layer that would tell you which models are causing the most support headaches, which geographies have the highest warranty claim rates, and which products owners love enough to scan repeatedly months after purchase.
Sales data is a lagging indicator. Product interaction data is a live signal. The gap between those two things is where most manufacturers are flying blind.
The 6 Data Streams You Are Not Capturing
Every connected product generates at least six distinct data streams. Here is what each one tells you, and what you're forfeiting by not capturing it.
| Data Stream | What Gets Captured | Business Intelligence |
|---|---|---|
| Scan location + time | approximate country-level location, time of day, device type, scan frequency | Geographic deployment map, usage patterns, counterfeit cluster detection |
| Registration demographics | Owner identity, address, purchase channel, purchase date | True end-customer database, channel attribution, customer profile segmentation |
| Support patterns by model | Issue type, frequency, time-since-purchase, resolution path | Which models have design flaws, which need proactive service campaigns, where call centre volume will spike |
| Parts demand signals | Which parts ordered, for which models, from which regions | Demand forecasting for spares, manufacturing planning, early indicator of wear patterns at scale |
| Warranty claim clusters | Claim type, geographic concentration, model/batch correlation | Defect detection before it becomes a recall, supplier quality intelligence, field failure rates by production cohort |
| End-of-life disposition | Product return, trade-in, recycling centre registration | Actual product lifespan vs. designed lifespan, circular economy compliance, replacement cycle prediction |
For a detailed exploration of what QR code analytics can reveal about scan data, including how to extract competitive intelligence from aggregated patterns, see our analytics guide.
These are not theoretical data points. Every one of them is generated the moment a customer interacts with a product, through a scan, a form, a call, or a return. The only question is whether you have infrastructure in place to capture it.
What This Tells You That Sales Data Cannot
Which Models Have the Most Engaged Owners
Scan frequency is a proxy for owner satisfaction that no survey can replicate. When owners are scanning a product's QR code repeatedly, checking manuals, ordering accessories, registering for extended coverage, they are demonstrating active engagement. That signal can be more honest than a survey score.
Conversely, a model with near-zero scan activity after the first registration is telling you something. Either the product experience is not compelling enough to drive repeat engagement, or the QR code experience is so poor that owners stop trying. Either way, you have a problem, and you'd never see it in quarterly sales figures.
Where Counterfeits Cluster Geographically
Connected product analytics enables something that was previously impossible at scale: real-time counterfeit mapping. When genuine products are scanned in a specific geography, you establish a baseline. When scan attempts return invalid serial numbers, or when the same serial appears simultaneously across multiple geographies, you have a counterfeit signal.
This is not theoretical. For makers of power tools, industrial consumables, and consumer electronics, counterfeiting is a persistent problem in some regions. Without serialised scan data, you have no visibility into where the problem is concentrated or how it is growing.
Which Products Need Proactive Support
Support pattern data by model is one of the most actionable datasets a manufacturer can build. If a particular unit generates support calls at a noticeably higher rate than comparable models at the same point in their life, that is a product engineering signal, not a customer service problem. If warranty claims for a specific component are clustering in cold-climate regions, that is a design validation failure that is invisible without geographic claim data.
Manufacturers who collect this data can run proactive service campaigns, contacting owners before failures occur, dispatching parts preemptively, or issuing firmware and instruction updates, rather than waiting for the call volume to spike. The potential difference in support cost per unit can be meaningful. The difference in customer retention can be larger still.
Your Competitors Aren't Collecting This Either, Yet
Here is the uncomfortable reality about first-mover advantage in product data: the window is open, but it won't stay open indefinitely.
Many manufacturers in any given category are in a similar position. They have product sales data, CRM records for key accounts, and maybe a warranty claims database that nobody looks at. They do not have serial-level product intelligence. They do not have post-sale scan data. They do not know where their products are in the field.
That means the manufacturer who builds this infrastructure first can arrive at a structural advantage that compounds over time. Several years of product scan data is worth more than a few months. A model-level support database covering many product generations is more actionable than one covering only a couple. The longer you collect, the better your predictive models, the better your new product development, and the better your service economics.
Connected-product capabilities tend to be split across separate tools: some focus on supply-chain authentication, some on retail-facing scan experiences, some on enterprise-scale consumer goods. What is harder to find is the combination of serialised product identity, no-code experience management, and post-sale owner intelligence in a single platform accessible to mid-market manufacturers, which is exactly the gap that product lifecycle data platforms are designed to fill.
AI Readiness: You Can't Train a Model on Data You Never Collected
There is a second-order consequence of this data gap that almost nobody is talking about.
Many product categories are moving toward AI-assisted product support. The vision is compelling: an owner scans their product, describes an issue, and an AI assistant trained on many similar cases provides an accurate, contextual resolution path in seconds. No hold music. No escalations. No repeat calls.
That AI assistant needs training data. Specifically, it needs the support interaction history for your products: which issues occur, which resolutions work, which product configurations cause which problems. Without that dataset, you cannot build a useful AI product assistant. You can build a generic chatbot that searches your manual, but that is not the same thing.
The manufacturers who are collecting product interaction data today are building the training corpus for tomorrow's AI layer. The ones who are not are deferring that investment, and every month of deferral is a month of training data that will never exist. Understanding how connected products drive real ROI, including the compounding value of multi-year datasets, is essential for securing the investment needed to start capturing this data today.
The cost of disconnected products is often measured in missed revenue or elevated support costs. The AI readiness gap adds a third dimension: technical debt that makes future investment more expensive and less effective.
From Invisible to Intelligent: What It Takes
The barrier to capturing product interaction data is lower than most product managers assume. It does not require rebuilding your ERP, re-engineering your supply chain, or deploying IoT hardware to every product.
It requires three things:
1. Serialised product identity. Each unit needs a unique identifier, not just a model number, but a serial-level QR code encoded to GS1 Digital Link standards. This is the anchor that ties every subsequent interaction to a specific product, production batch, and distribution path.
2. A connected experience that gives owners a reason to scan. Warranty registration, digital manuals, spare parts ordering, support access: any of these gives an owner a reason to interact with their product digitally. The scan event is the data collection moment. Make the experience valuable enough and owners scan repeatedly.
3. A data layer that captures and surfaces the signals. Scan events, registration completions, support interactions, and parts orders need to be stored at the serial level, queryable by model and geography, and surfaced in a form that product, service, and marketing teams can act on.
BrandedMark is built around exactly this architecture: serialised QR codes linked to no-code product experiences, with every interaction captured and attributed to individual product units. It is designed for manufacturers who need to build this capability without a multi-year IT programme.
Frequently Asked Questions
How is product scan data different from website analytics?
Website analytics tells you who visits your digital properties. Product scan data tells you what happens to your physical products after they leave the factory. The two datasets are complementary but distinct: scan data is anchored to specific serialised units in the real world, carries geographic precision, and correlates directly with individual product instances rather than anonymous browser sessions. It is structural product intelligence, not digital marketing data.
We sell through distributors, can we still collect this data?
Yes, and this is precisely where the value is highest. Manufacturers who sell through distributors typically lose visibility at the point of handover. Serialised product scanning re-establishes that connection at the moment the end-user interacts with the product, regardless of which distributor, retailer, or installer the unit moved through. The scan becomes the direct relationship between manufacturer and end-user, bypassing the channel opacity entirely.
What is the minimum viable approach for a manufacturer just starting out?
The lowest-friction entry point is serialised QR codes on packaging or product labels, linked to a warranty registration experience. Even a basic registration flow, capturing owner identity, purchase date, and purchase channel, begins building the product-level dataset immediately. From there, adding support access, spare parts links, and richer experience content compounds the data and engagement over time. You do not need a full platform deployment to start collecting. You need the data infrastructure in place before you have a reason to wish you had it.
BrandedMark is the Product Operating System for manufacturers of physical goods: serialised product identity, connected experiences, warranty registration, and Digital Product Passport readiness in one platform. See how it works at brandedmark.com.